Is Generic Network Monitoring Software Good Enough for a WISP?
A lot of WISPs start out monitoring their network with whatever general-purpose tool the founder already knew. That’s usually one of LibreNMS, Zabbix, PRTG, Observium, or MikroTik’s own Dude, and they’re all fine tools that do what they were built for very well. The thing is that they were built for datacentres and office networks, where the devices are switches, servers and a few core routers, everything is wired, and the main questions are “is it up” and “how busy are the interfaces”.
A wireless ISP has those questions too, but they’re the easy part. Most of the problems that generate support calls happen on the wireless side, on the backhauls between towers and on the last mile to each customer’s radio, and that’s where generic tools start needing a lot of extra work to keep up. Here’s what we think the important differences are, in roughly the order they start to hurt as a network grows, and how Swift Fox’s monitoring handles each of them.
Pinging every customer radio, every minute
ICMP ping is still the gold standard for “is this up or down”. It works on every device with an IP address regardless of vendor, it costs nearly nothing, and unlike an AP’s association list it tells you whether packets are getting through right now rather than whether the radio was seen recently.
The difference on a WISP is the number of things you want to ping and how often. It isn’t enough to ping the tower and the access point, because a customer’s radio can be reachable while its link drops packets every few minutes, and those tiny outages are still felt by the customer (a two-minute drop in the evening is a frozen video call, and they’ll remember it even if the AP never noticed). So you want to ping every single customer radio, at least once a minute, and keep the results.
We send fairly large pings for this (1300 bytes, with customers tested every 60 seconds and infrastructure every 20), since a marginal wireless link will often pass small packets fine and start dropping the big ones first.
That’s a lot of data. A network with 2,000 customers generates just under three million ping results a day, and a generic NMS will store all of it and then give you either a grid of green and red dots or two thousand individual latency graphs, neither of which anybody can read. What makes the data useful is how it’s shown, and the format we settled on years ago (we were writing about it in 2014) is a heat map: one row per customer with one colour-coded stripe per minute, grouped by access point, so a whole sector’s day fits on one screen.
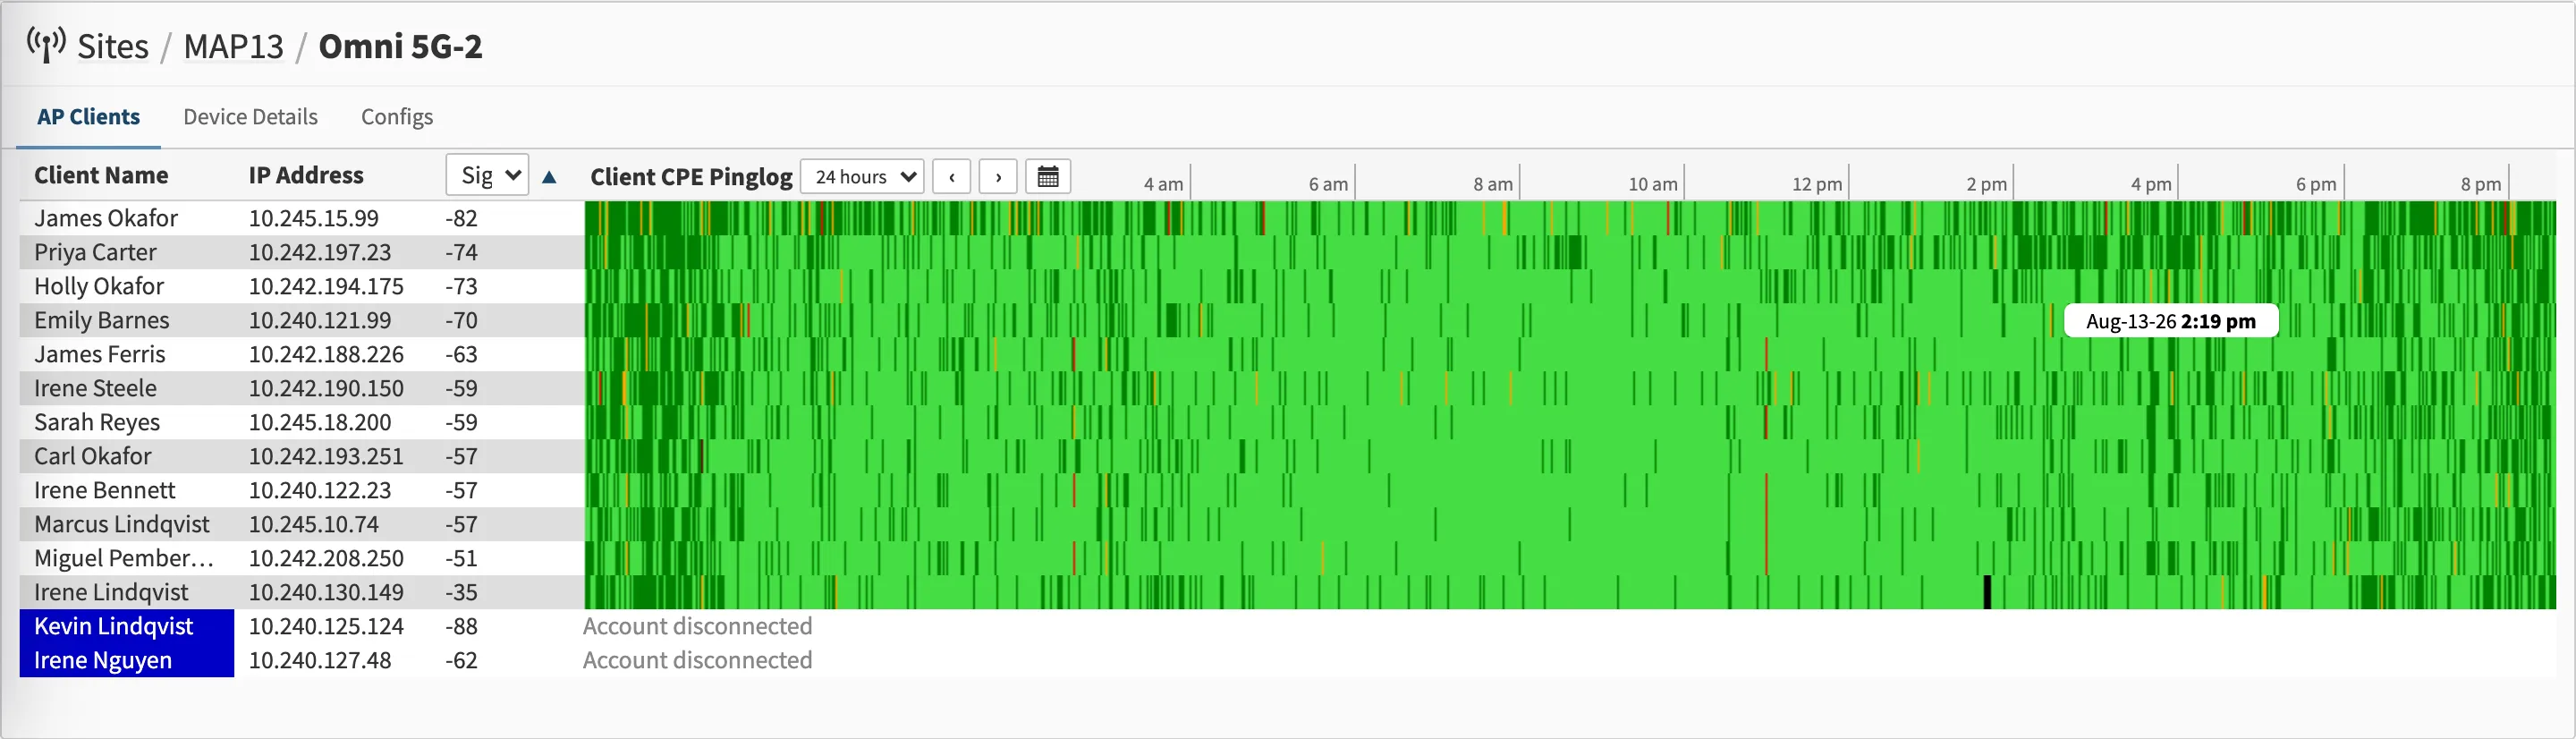
Every customer on one access point in Swift Fox, one row per radio, with a 24-hour pinglog strip for each.
Once you can see it that way the patterns are obvious. A vertical stripe that hits every customer at the same time is a problem at the AP or above it (noise on the channel, a backhaul, power), while a single row going yellow on its own is that one customer’s radio, cable, or tree. A sector whose colours slowly creep from bright green to dark green to yellow over a few months is running out of capacity, and you can see that long before the phone starts ringing.
There’s a related administrative difference that matters a lot at this scale. Nearly every generic NMS expects you to add each device by hand, or run a discovery scan and then sort through what it found. That’s fine for thirty routers, and a real chore for two thousand customer radios that get installed, swapped and moved every week.
WISP-specific software can read the association tables off your access points and start monitoring a new customer radio as soon as the installer brings it up. And because the monitoring lives in the same system as the customer’s account, provisioning their package or pulling up their pinglog when they call is one click rather than a trip through two or three separate systems.
History that goes back years, at full resolution
One less obvious thing to check is what happens to that per-minute data after a week. A lot of generic tools (the ones built on RRDtool especially) poll every five minutes by default and then average older data down into hourly and daily points to save space. Averaging is a bad fit for ping results though. A three-minute outage every evening disappears entirely once it’s blended into an hourly average, and so does the slow decline in a link’s modulation that started six months ago.
You want the raw minute-by-minute history kept for as long as you own the network, because a lot of WISP problems only make sense over long timescales. Looking at a customer’s signal going back three years is how you find out that the trees along their path have grown a couple of metres, or that the slow drop in a backhaul’s modulation rate started right after a pigtail got replaced during a storm repair. Storage is cheap enough now that there’s no good reason to throw this away, but a lot of generic tools still do by default.
Measuring backhaul capacity
Backhauls are where a WISP is most different from a wired network, and most generic tools treat them like any other interface, with an up/down state and a pair of byte counters. What you need is a measure of how much the link can carry right now, and three kinds of measurement cover it.
The first is automated TCP throughput tests between the routers on each end of a backhaul. The radios will tell you their modulation rate (MCS), and it’s a useful number, but the MCS only describes the radio link, and there’s a surprising amount that can go wrong between two routers that it won’t show you. A degraded ethernet cable that’s negotiated down to 100 Mbps, a queue rule somebody added during an outage and forgot about, or an unmanaged switch that was installed inline three years ago and is now starting to fail will all look fine from the radio’s point of view and fail a real throughput test.
We run a single-stream TCP test in each direction on every MikroTik-to-MikroTik backhaul roughly every fifteen minutes, and read the interface’s total throughput during the test so that customer traffic already on the link counts toward capacity. There’s no need to take the link out of service, and the number you get is what the link can carry with the cable, the switch and the queue rules included.
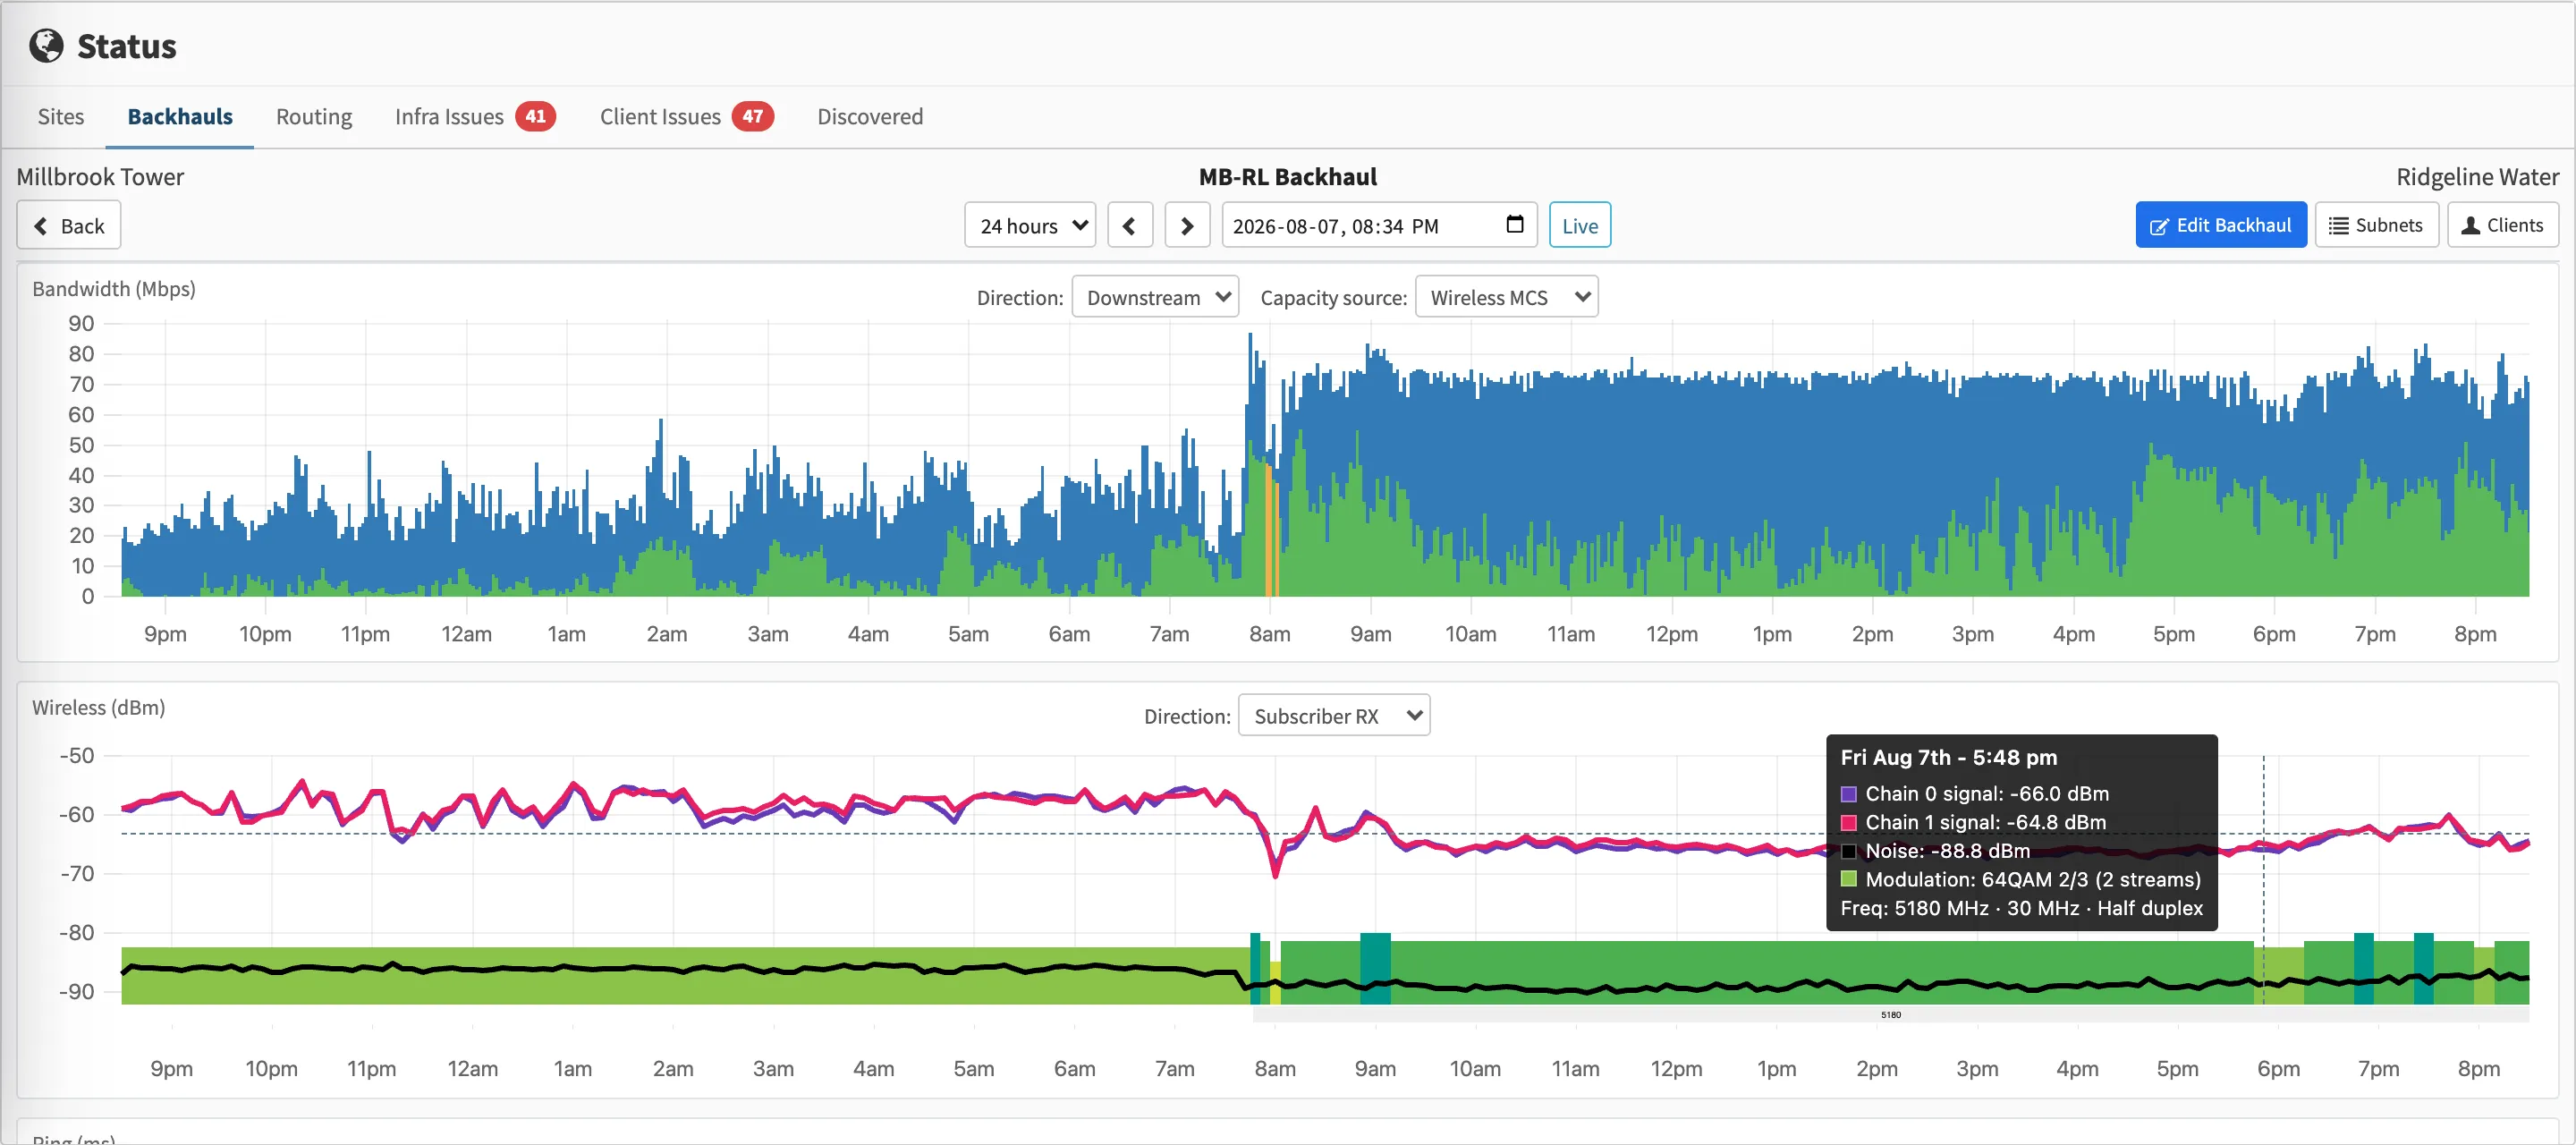
A Swift Fox backhaul page through an overnight modulation drop. Measured capacity falls, and the wireless chart underneath shows why.
The second is pings between the two ends of each backhaul, sent by the routers themselves rather than from your monitoring server. When a customer reports high latency, the question is always whether it’s this one link or something else along the path, and a ping from the NMS in the datacentre has to cross every other hop to get there.
A ping sent from the router on one end, out the backhaul interface, to the router on the other end gives you an isolated measurement of that link and nothing else (we send 20 pings of 1300 bytes a quarter second apart, every minute, from each router). Graphed next to the throughput tests, it’s about the best “is it just this link” answer there is.
The third is polling the radios every minute for the things that describe the wireless link itself: signal, modulation rate, channel width, and frequency, on both the AP and the SU side. Having every radio’s channel on one chart means you can coordinate the channel plan for a tower at a glance instead of maintaining a spreadsheet, and it flags the two radios on a site that are pointing at each other on the same frequency.
Having the signal and modulation history on the same graph as the throughput tests is what lets you tell whether a channel change improved anything, or whether a link has been slowly losing a dB a month to a corroding connector.
TCP latency, for the part of the path pings can’t reach
Pinging the customer’s radio tells you about your network up to the radio. It doesn’t tell you anything about the customer’s own router, their Wi-Fi, or the path from your gateway out to the services they use, and if they’re behind CGNAT or their own NAT you can’t ping past the radio anyway.
Passive TCP latency monitoring fills in that gap. Instead of sending anything, it watches a mirror of real customer traffic at the edge router and times the gap between a data segment going out and its acknowledgement coming back, per customer and per direction. That gives you the customer’s real experience end to end, including everything past the radio, without adding any traffic to the network. On our pingboxes this comes from a packet sniffer stream off the MikroTik edge router (TZSP), and the results show up on the customer’s page next to their pings. On our Pathboxes this is measured directly in the inline device.
It isn’t a replacement for pings though. A customer who’s asleep and not moving any traffic looks exactly like a customer who’s offline, since both produce no data, so you need both measurements, with ICMP telling you whether the link is up and TCP latency telling you how it feels when it’s being used.
Support for the vendors you run, beyond SNMP
Every vendor has a decent tool for their own gear. cnMaestro is good for Cambium, UISP is good for Ubiquiti, and the Dude is good for MikroTik, and if your whole network is one vendor, that vendor’s tool is probably all you need. Very few real WISP networks are though. A typical one has a MikroTik core, a mix of Ubiquiti and Cambium sectors, and a few licensed or 60 GHz backhauls from somebody else, and running three vendor dashboards plus a generic NMS to tie them together means nobody really has the full picture.
The generic tool’s answer is SNMP, and SNMP is fine as far as it goes. A lot of wireless vendors don’t expose everything through it though (the per-client signal and modulation on an access point is a common gap), and a few have let their SNMP support fall behind their newer features. Getting complete data means using whatever each vendor does offer, which in practice is a mix of SSH, HTTP, and vendor APIs alongside SNMP, and WISP-specific software does that work for you rather than leaving you to write and maintain the collectors.
Alerting for the things that matter to a WISP
A generic NMS can alert on anything you can express as a threshold, but you have to build every one of those thresholds yourself. The things a WISP needs to be paged about are fairly specific: a backhaul crossing 80% utilization in real time (rather than the MCS dropping, which may or may not matter), a site’s batteries falling below half charge or a site going onto battery at all, a link failing over to its backup radio, or a DFS hit moving a radio off its channel.
All of that is achievable in Zabbix or PRTG with enough custom items, templates, and trigger expressions, and we’ve seen operators build very good setups that way. It’s also a lot of very specific configuration that somebody has to maintain, and in most WISPs that somebody also has a network to run.
The other piece is time of day. A backhaul at 90% at noon on a Tuesday is something you want to know about right away, at your desk, while the same backhaul at 3am might not need anyone woken up for it. Paging rules with different thresholds and different on-call people for weekdays, evenings, and weekends become essential once there’s more than one of you. Generic tools can do it with maintenance windows and escalation chains, but WISP-specific software tends to ship with the timespans, severities, and per-metric defaults already there, so setting it up is mostly picking who gets the SMS.
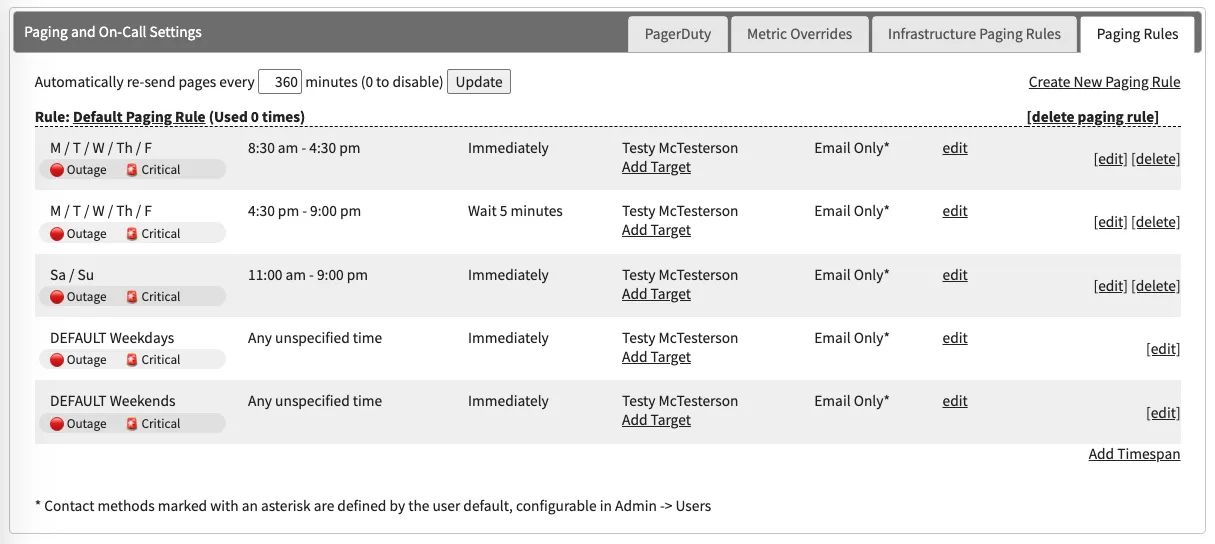
Swift Fox's paging rules, with timespans, assigned users and delivery methods. The defaults are already set up for a WISP.
Who maintains it when the firmware changes
The last difference is about maintenance rather than features. Open-source tools are great and a lot of WISPs run them well, but the collectors for wireless gear are the part that breaks most often, because vendors change their APIs and their CLI output in firmware updates fairly regularly (RouterOS v7 moved wireless into a new package with different output than v6, for example, and every collector that parsed the old format had to be redone).
When that happens on a generic tool, you’re the one patching the template or the OID list, or waiting for someone on the forum to. With a WISP-specific vendor, keeping the collectors working against new firmware is their job, and it keeps you working on your own network instead of on your monitoring.
The same goes for when something’s wrong and you can’t figure out why. Community forums are hit and miss, and a question about the collector for a modulation graph can sit unanswered for weeks. A WISP software vendor has engineers you can call who have run these networks themselves.
So is generic monitoring good enough?
For the core of the network it usually is. A generic NMS is a very good way to watch your servers, your switches and your gateway routers, and there’s no reason to stop using one for that. It starts to fall short as soon as you need it to watch the wireless parts, which for a WISP is most of the network, and the cost of making it good enough there is mostly your own time: adding every customer radio by hand, building the collectors and dashboards, and keeping all of it working through every firmware release.
Everything above (per-minute pings on every radio, measured backhaul capacity, passive TCP latency, frequency planning, and paging with time-of-day rules) is included in Swift Fox’s Network Management tier for $0.75 USD per subscriber per month, and it runs alongside whatever you already have. If you’re on a generic NMS today and would like to see what your network looks like with the wireless side monitored properly, reach out and we’ll set up a trial on your topology.