How to Detect a Failing WISP Backhaul Before Your Subscribers Notice
When a backhaul starts going bad, the first sign is usually a wave of support calls from one part of the network, and none of them will mention a backhaul. Customers will say the internet is slow in the evenings, or that their video calls keep freezing, and the people calling will be spread across every access point behind the tower that link feeds. Working out which link it is, and what’s wrong with it, is one of the most common troubleshooting jobs on a WISP, so here’s how we go about it, both by hand and with the automated tests Swift Fox runs on every backhaul.
The first step is finding which backhaul it is. After that, the two things to determine on that link are whether it’s short on bandwidth capacity, or whether it has unstable latency or packet loss. Those two measurements tell you whether there’s a problem at all, and if you have them running automatically on every backhaul you’ll know before your subscribers do. The signal, noise and modulation history then tells you why, and the last section covers what you can do while the link is still degraded and the proper fix is weeks away.
Which backhaul is it?
To narrow a wave of complaints down to one link, you’ll want a network management system that gives you a map of every backhaul on the network and colour codes each one by how it’s doing right now. The important part is what the colour is based on. A map that turns a link red when a single SNMP value crosses a threshold (the interface went down, or the signal dropped below a number you typed in) will miss most of what goes wrong with a backhaul. What you want is a colour that comes from the aggregate of the measurements in the next two sections, the measured capacity of the link against the traffic on it, and the latency and packet loss of pings sent across that one link, so a backhaul that’s full at prime time or dropping one packet in fifty shows up as yellow on the map before anyone calls.
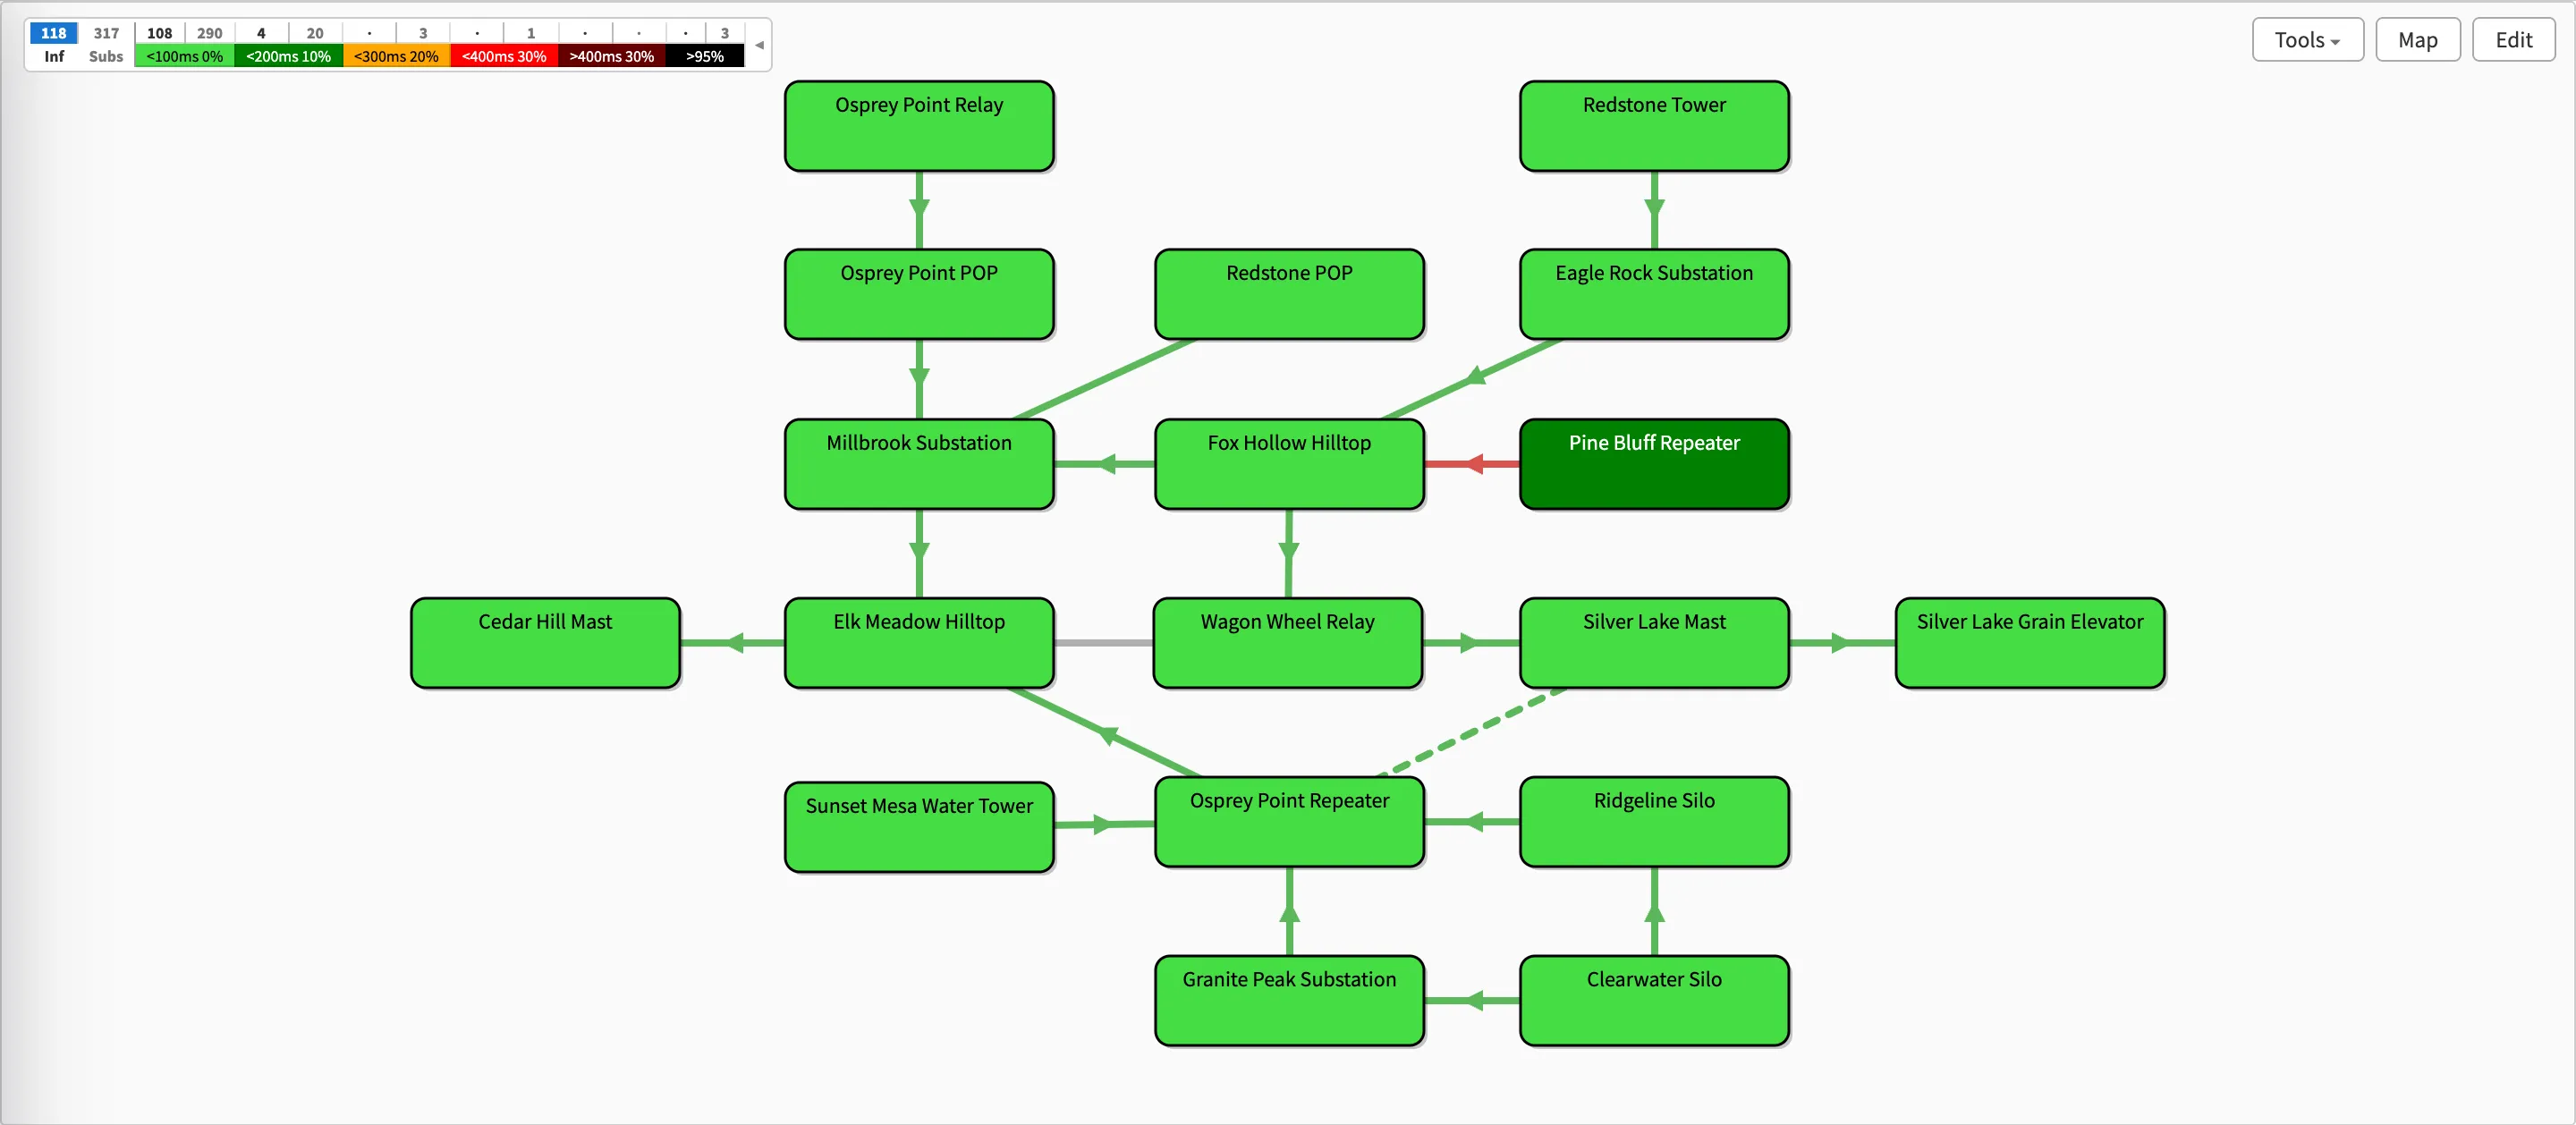
Swift Fox's network map with every backhaul coloured by its measured capacity and per-link ping quality. One link has gone red, so that's where to start.
Once the map points at a link, the rest of this post is about that one link.
Can’t a traceroute answer this?
Yes and no. If a backhaul is degraded enough and you have a fully routed network, you can often spot it in a traceroute as the hop where the latency or loss suddenly jumps, and it’s a fine thing to try while a customer is on the phone. A lot of backhaul capacity problems only show up as a reduction in throughput though, with the latency staying normal until the link is completely saturated, and a traceroute doesn’t measure throughput at all. By the time a link is dropping pings it’s usually far too late. The customers have already noticed, and you’ve lost the early warning that ongoing aggregate monitoring gives you.
Measuring the capacity of one backhaul
If you have a router on each end of the link, it’s fairly easy to run a speed test that isolates just that one backhaul. Log into the remote router, set up a TCP speed test with a single stream (on MikroTik that’s the bandwidth test tool with connection-count=1, since it defaults to 20 parallel connections), and run it in both the TX and RX directions. There are a few tricks that make this a lot more useful:
- Watch the interface statistics during the test. While the test is running, open the interface statistics for the backhaul (assuming it’s on a dedicated interface) and watch the peak throughput shown there. That number is just as important as the speed test result, because it’s the total capacity of the link including the customer traffic already on it. The speed test on its own only shows you the capacity that customers aren’t using.
- Use TCP, and only a few streams. This is also why you want a small number of TCP sessions rather than UDP or a lot of parallel streams. A test with too many sessions, or a UDP flood, crowds out the customer traffic and makes the subscriber experience worse while it runs. Some very high capacity links do need more than one TCP stream to fully exercise them though.
- Leave the random data option off. If the router doing the test offers a random data feature, you usually don’t need it. Generating random traffic takes a lot more CPU, and on a smaller router that becomes a bottleneck of its own. The only time it’s really needed is when the wireless link has compression enabled, in which case a test with non-random data reads very high (often higher than the link’s real capacity). That’s fairly rare.
- Test to an IP on the link’s own subnet. Make sure the IP you’re testing to is on the same subnet as the router you’re testing from. On a fully routed network that’s usually a /30 or /29 that exists just for this link. If you use a loopback address or some other IP on the remote router, the test can end up running over a completely different route that doesn’t include the backhaul you’re trying to test.
Ideally you’ll want to run these tests automatically and track the trend between them, because there are two different things you can spot with the history. If the maximum capacity of the link is changing over time, then the backhaul itself is worth a closer look, and the signal section below is where to go next. If the capacity is constant but the traffic across it is reaching the maximum at peak times, then the link is fine and just full, and it’s time to upgrade it, add a second backhaul for load balancing and redundancy, or see if a change to the channel width, frequency, or alignment can get more out of the radios you already have.
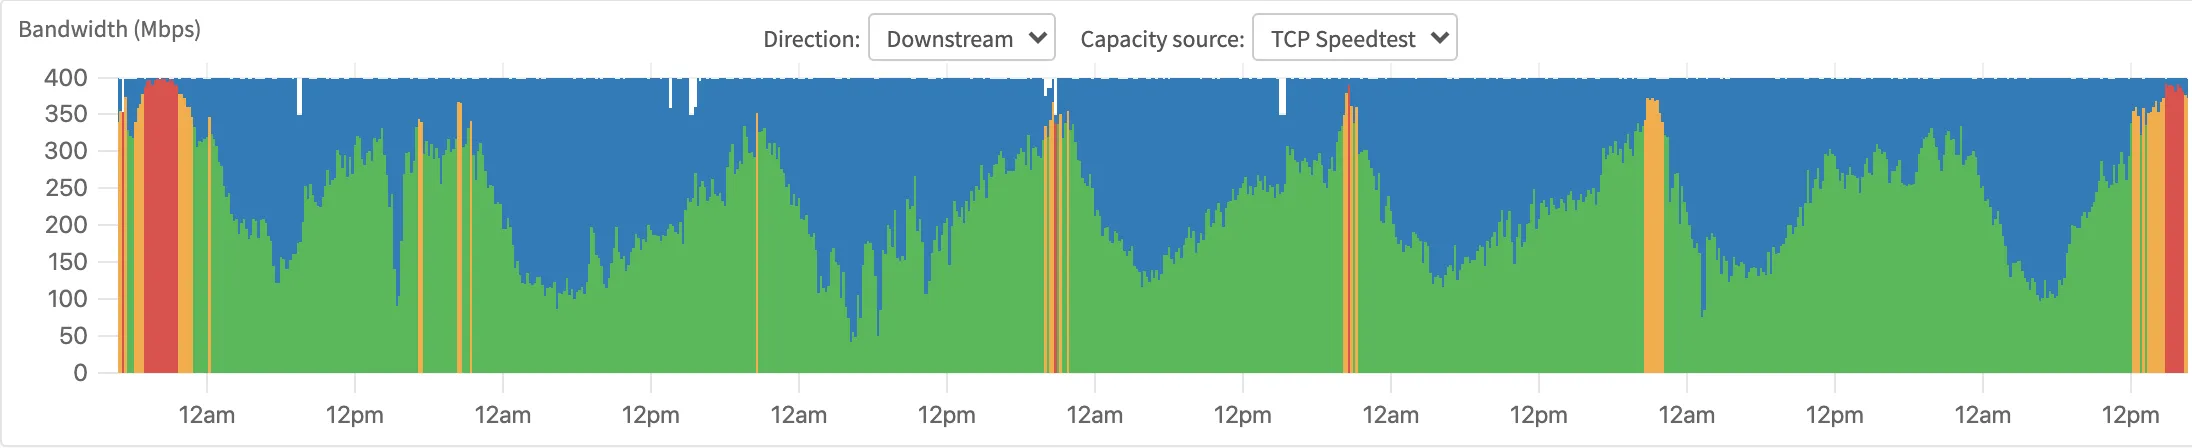
A week on a 400 Mbps backhaul in Swift Fox. The measured capacity (blue) hasn't moved, and the evening peak reaches it most days (the orange and red are where it saturated). This is the link that's fine and just full.
Pinging across one backhaul
This one is pretty straightforward. Run pings across the backhaul and look for dropped packets and whether the latency is consistent. There are a few gotchas here too:
- Send large pings. 1300 bytes is a good size. Big packets more closely simulate heavy subscriber traffic and are the first to get queued or dropped when the link is under load, so they show a marginal link long before small pings do.
- Send them router to router, on the link’s own IPs. Run them from the downstream router to the upstream one (or the other way around), using the same /30 addresses the bandwidth test uses, so they can’t take another route.
- Ping quickly, with a short timeout. Every 500 ms or even 250 ms gets you a lot more sensitivity to small drops than one ping a second does.
- Isolate the link. It’s important to run these across just this one link, rather than across the whole network from your monitoring server. Network-spanning pings are useful too, since they’re the best indication of the true subscriber experience, but they don’t narrow down the “where” or the “why” of a problem. When the customers on one tower are complaining and there are three backhauls between them and your gateway, a per-link ping on each of the three is what tells you which one it is.
Same as with the speed tests, having automated pings running across each backhaul in isolation, graphed at high resolution, is very useful for catching short outages, capacity problems at prime time, and even rare RF events like atmospheric ducting that you’d never catch by hand.
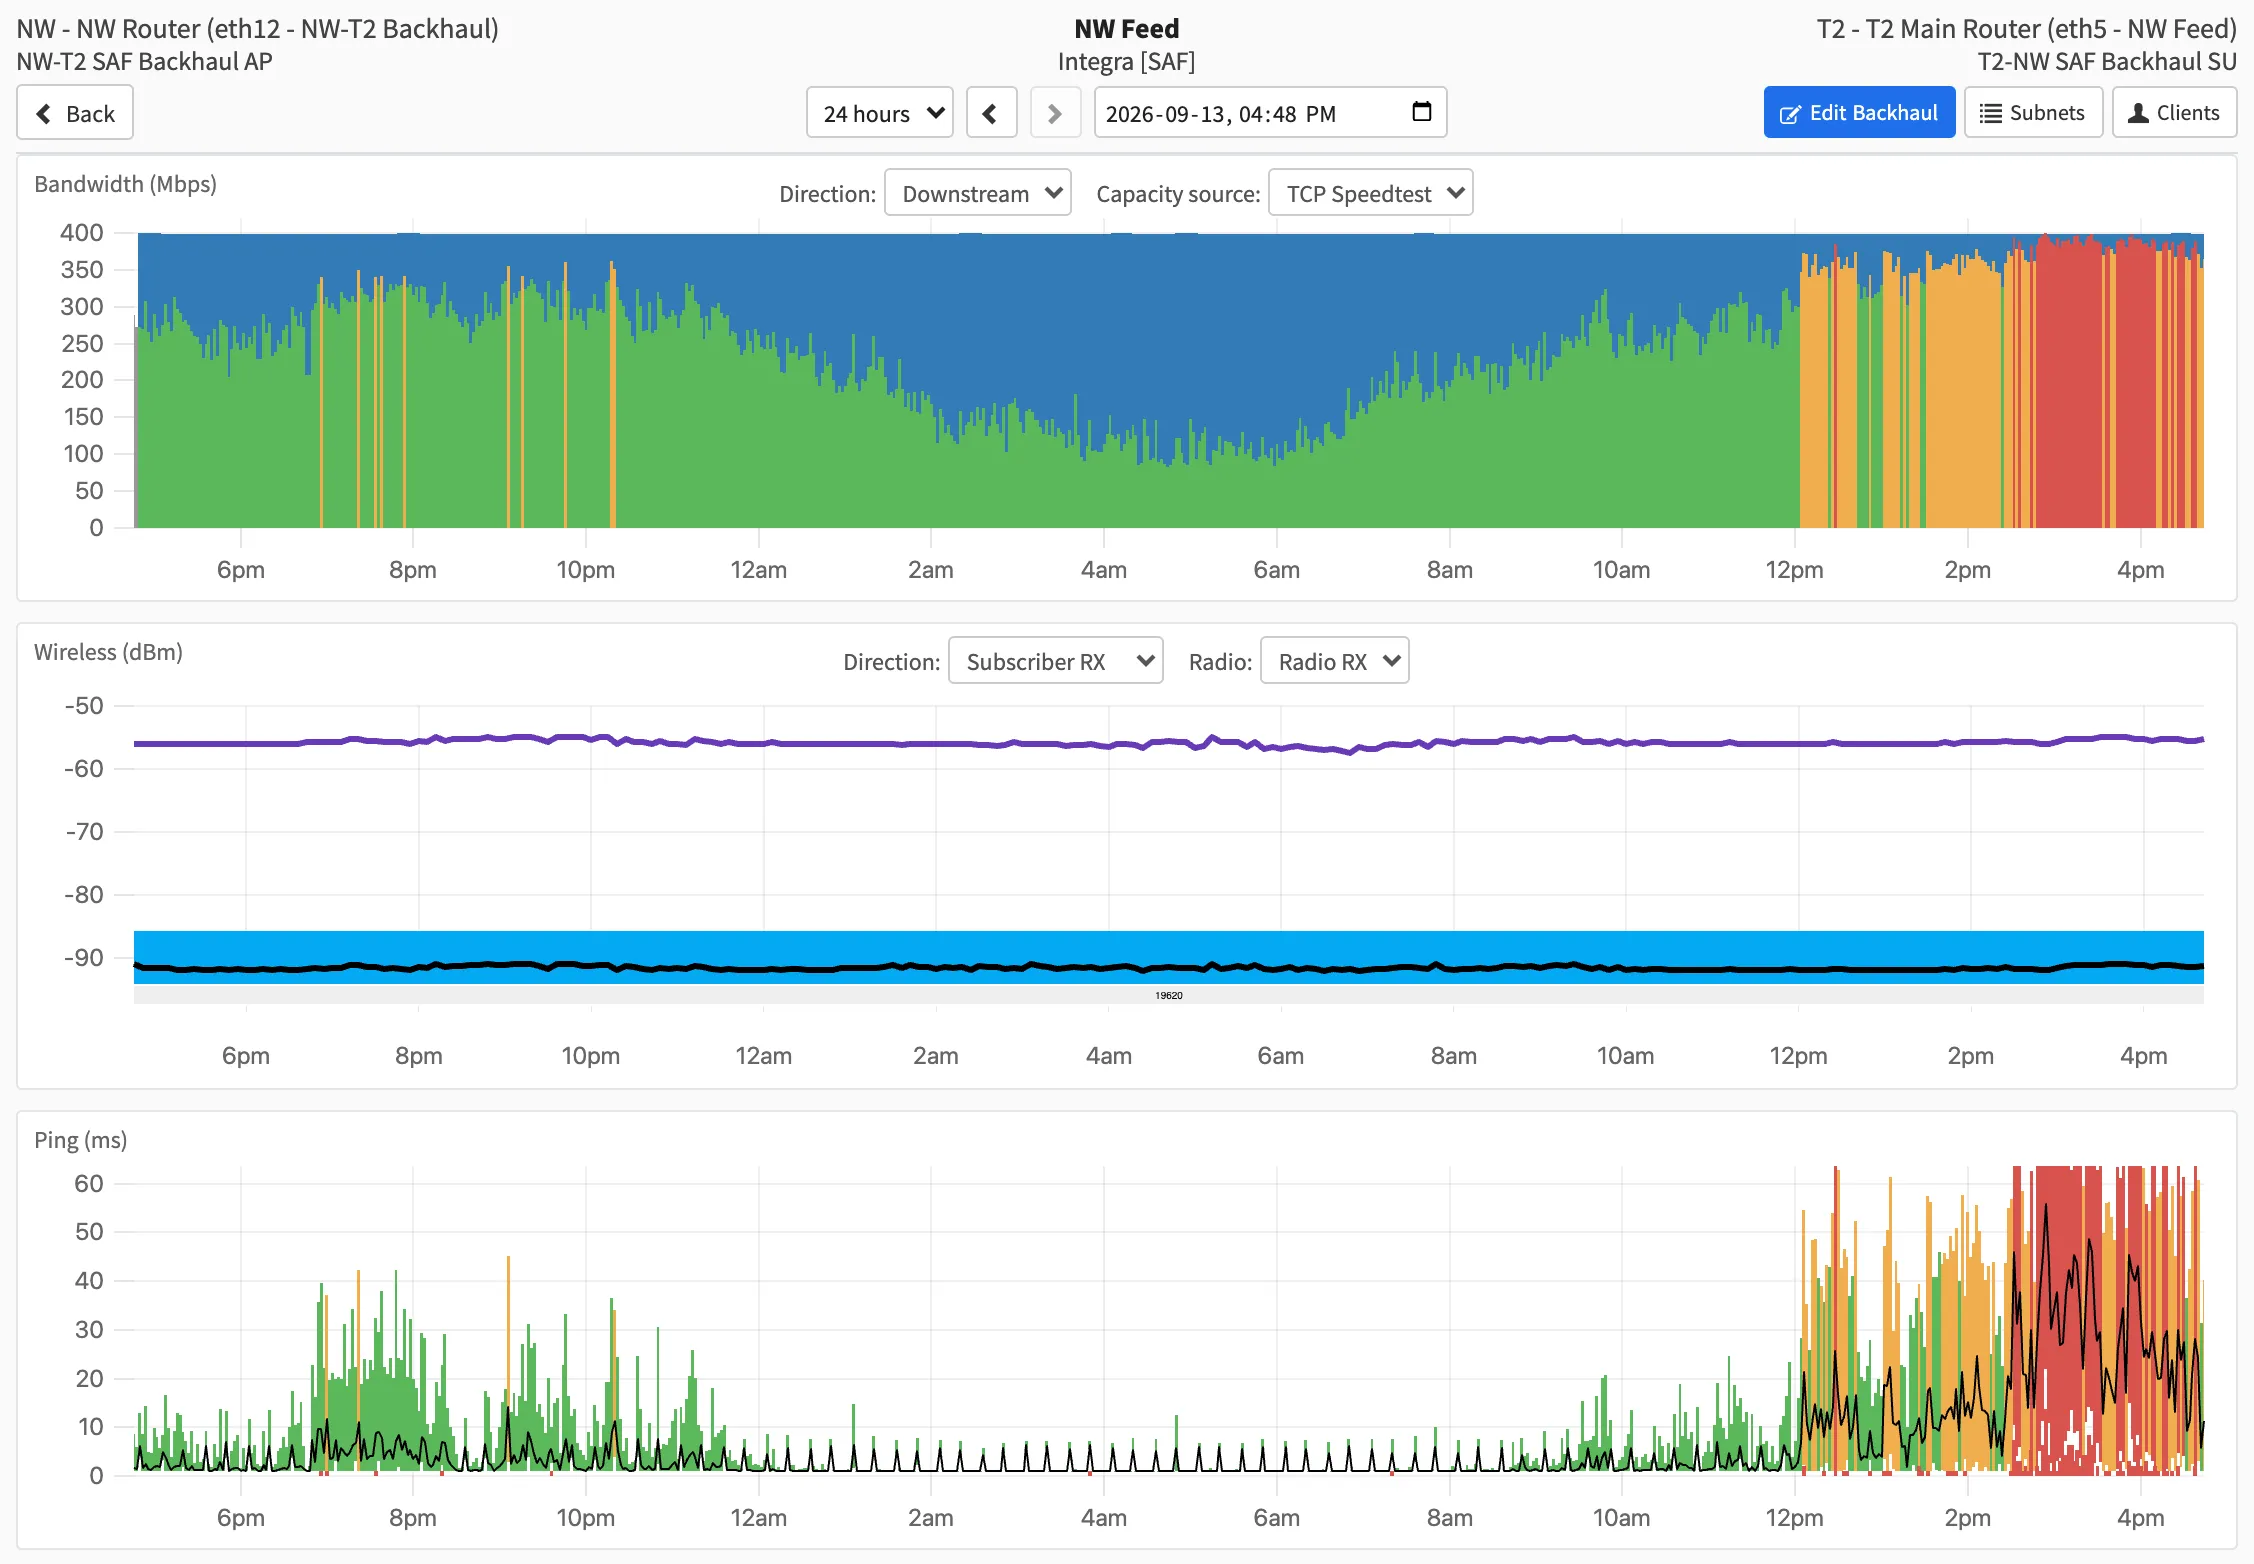
A 400 Mbps backhaul over 24 hours on its Swift Fox backhaul page, with the signal and the per-link pings underneath. From noon the traffic reaches the measured capacity, the signal doesn't move at all, and the pings go orange and then red over the same hours.
Those two measurements are the most important ones, because they tell you there’s a problem in the first place, and if they’re automated you know before your subscribers do. Once you know there’s a problem though, how do you narrow down what to fix?
Narrowing down the cause with signal, noise and modulation
Signal, noise, and modulation rate are the next things to check and track, because they tell you a lot, especially if you can compare them across time and against the capacity history from above. Here are the situations that become clear once you have the right data.
The signal has dropped
Capacity and signal both drop suddenly, on both sides of the link. This is almost always an antenna mount failure on one end, which pulls the link out of alignment, and it’ll need a truck roll to fix. If the backhaul doesn’t have much height above ground level, it can also be a large truck parked in front of it, or a passing ship if the link crosses water.
If it’s a long link above about 10 GHz, check whether there’s a big rainstorm going through. The higher the frequency, the more susceptible the link is to rain fade. Below 10 GHz rain barely matters, and an 11 GHz link needs a long path and a heavy downpour before you’ll notice it. From 18 GHz up, rain fade starts to set the fade margin for the whole design, and it’s a big part of why 24 GHz and millimetre-wave links are kept short (ITU-R P.838 has the rain attenuation curves by frequency if you want to work out the margin for your own path). If rain fade is a regular problem on a link, you may need a backup link at a lower frequency to pick things up during heavy rain events.
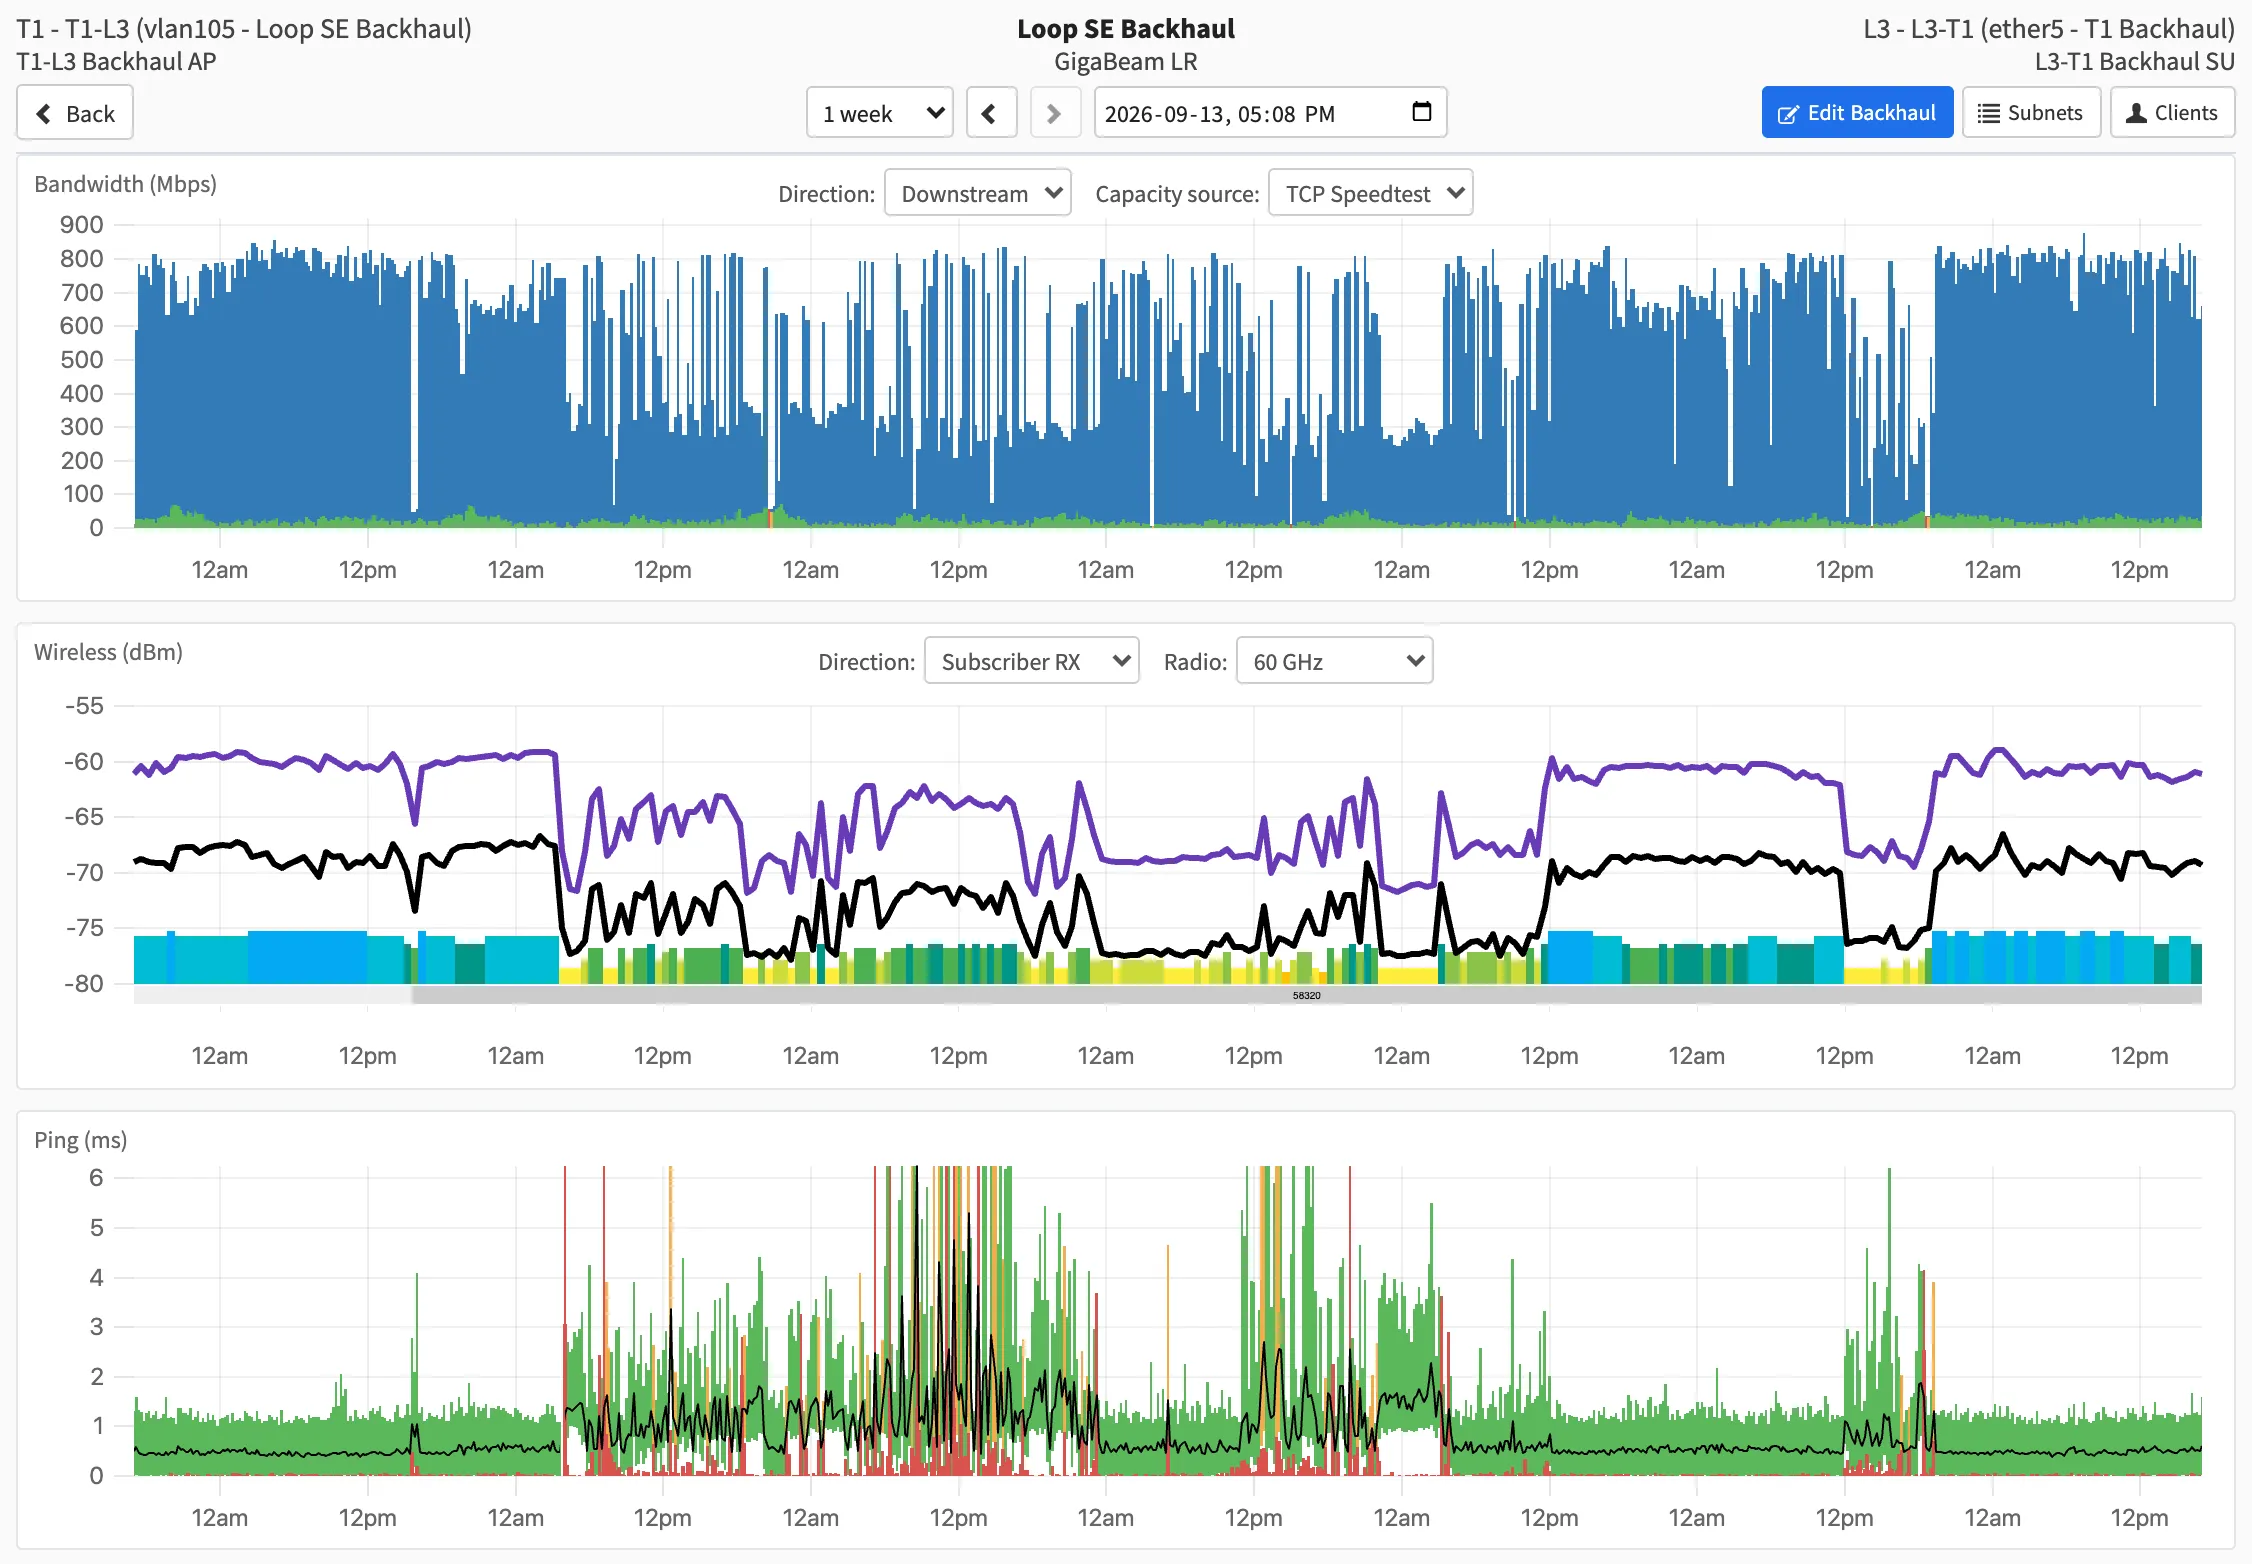
Rain fade on a 60 GHz link over a week, as graphed in Swift Fox. A few days of rain in the middle take the signal down by around 10 dB, the measured capacity drops from about 800 Mbps to a few hundred, and the per-link pings start dropping packets for the duration.
Capacity and signal drop slowly over a period of weeks. This often means an RF connector has failed and moisture is getting into the pigtail, degrading the link a little more each day. Check both ends to see that everything is still watertight.
Capacity and signal drop slowly over a period of months. Check the line of sight. There may be trees growing up into the Fresnel zone and attenuating the signal, which is very hard to notice day to day and obvious on a graph that goes back a year.
Capacity and signal drop suddenly, but only in one direction. This can be a radio failure. The side whose received signal looks unchanged may have a failing transmit stage, so it can still receive fine but can’t send as well as it used to, or it could be the receive amplifier on the other side that’s failing. It’s somewhat rarer, but it’s a failure mode that does turn up on full duplex links.
The signal is the same, but the capacity has dropped
If the signal is still high and unchanged but the capacity has dropped, it’s usually interference, either from another WISP or from one of your own towers. This won’t always show up as a higher measured noise floor. On unlicensed bands it’s worth trying another channel to see if it improves. An automated frequency planning tool helps avoid interference within your own network, and a lot of radios have a spectrum analyzer built in to help find the cleanest channels.
A few more cases
The modulation says the capacity is high, but the TCP test says it’s low. If the TCP capacity comes out in the mid-90s of megabits, check the Ethernet link speed on each radio, because it’s very likely a cable problem rather than a wireless one (a port that has negotiated down to 100 Mbps gives you about 95 Mbps of TCP). This is a good reason to do the full speed test from router to router rather than just radio to radio.
Even if the Ethernet link rates are as expected, it can be worth running pings across each layer 2 segment separately (the AP-side router to the AP, the AP to the SU, and the SU to the SU-side router), since a bad cable can still drop packets without renegotiating its speed.
If the Ethernet tests fine and the measured TCP capacity still isn’t matching the modulation rate, check whether the TX power override on either radio has been set unreasonably high. Some radios let you set the TX power higher than their output amplifier can actually handle cleanly, which distorts the signal in a way the modulation algorithm can’t account for, and a few 24 GHz models we’ve run over the years were especially prone to this. Reducing the TX power can improve the measured (and real world) TCP capacity, even though the capacity shown in the radio’s UI goes down.
The signal or noise changes suddenly, and so does the channel. If you’re operating in UNII-2 (5250 to 5350 MHz and 5470 to 5725 MHz), this is probably a DFS hit. The radio detected what it thought was radar, was forced off its channel, and the new channel it picked may perform a lot worse. With proper monitoring of the channel and DFS status you can be alerted when this happens and go assign a better channel, instead of finding out from the capacity graph a week later.
What to do while the backhaul is still degraded
Ideally you’d roll a truck and fix a backhaul as soon as you found the problem, or install another one to load balance if the link is simply over capacity. Often that isn’t doable right away though. New radios can take weeks to ship, the cash flow for an unplanned upgrade might not be there this month, or the field staff aren’t available to do the work.
With redundant paths this matters even more, because a degraded link that’s still up won’t trigger any failover on its own. OSPF keeps sending traffic through it at the same cost as the day it was installed, so the per-link tests above are the only way you’ll know one link of the pair has degraded at all.
There are still some options for keeping customers happy with a backhaul in a degraded state:
- Offload traffic onto your other backhauls. If you have redundant paths, move traffic onto the ones that are still good. In an OSPF network you can do this by hand by changing the cost of the links on each end. A balancing system using MPLS traffic engineering does the same thing automatically, splitting traffic according to the measured capacity of each link as soon as the degradation shows up.
- Add emergency capacity however you can. Two CPEs you already have in stock, pointed at each other and rigged up wherever you can get access, make an interim backhaul in a pinch, and even a modest amount of extra capacity helps. With MPLS balancing, that new link gets used alongside the degraded one automatically.
- Shape traffic to the backhaul’s real capacity. QoE shaping that knows the live capacity of each backhaul can keep customer traffic from saturating the degraded link while staying fair to everyone’s package speeds, so the link degrades gracefully instead of melting down at prime time. Watch out here, because a lot of QoE products don’t support this and can only shape traffic to package speeds or to access point capacity, so a bottleneck in the middle of the network is invisible to them.
How we do this in Swift Fox
All of the measurement above is built into Swift Fox’s network monitoring, and the network map colours every backhaul by those measurements. Single-stream TCP tests run automatically between the MikroTik routers on each end of every backhaul, roughly every fifteen minutes, with the interface throughput read during the test so customer traffic counts toward capacity. Each router sends 1300-byte pings across every link every minute. Signal, noise, modulation, channel width, frequency and DFS status are polled from the radios every minute and kept forever, so every pattern in this post shows up on the same graph as the capacity and ping history.
For the mitigation side, MPLS auto-balancing moves traffic across redundant backhauls as the measured capacity changes (on MikroTik routers, or inline via the Pathbox appliance for other cores), and Package-Fair Oversubscription is the backhaul-capacity-aware shaping.
If you’ve got a backhaul that’s been giving you trouble and you’re not sure why, we’d love to have a look at it with you. Reach out and we’ll set up a trial on your network.