Editable alert thresholds and uptime tracking
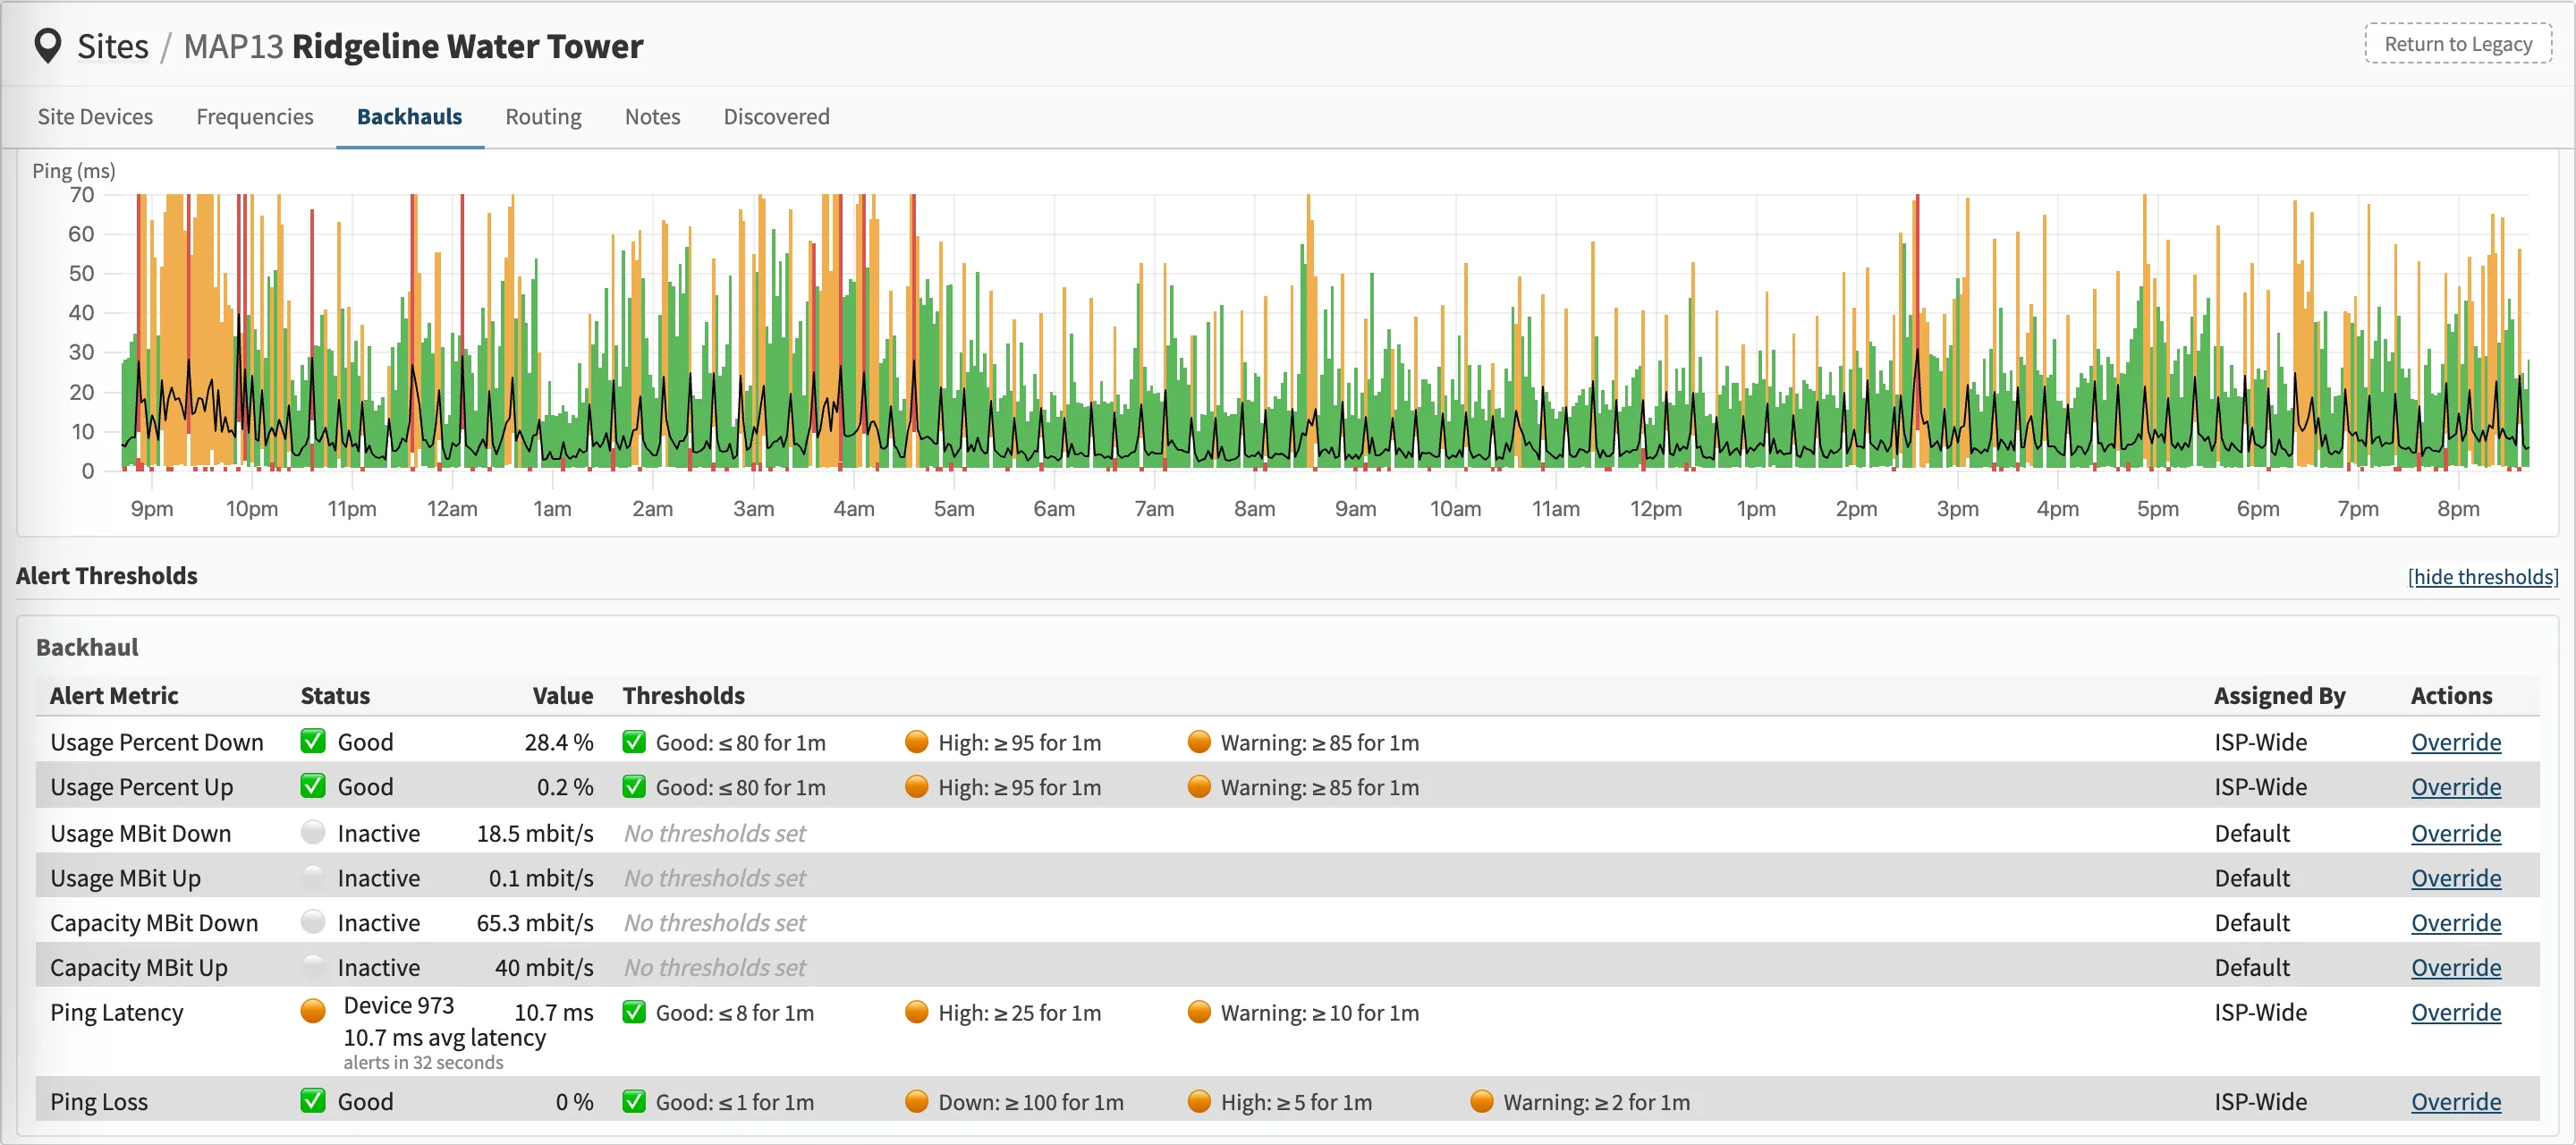
Alert thresholds are now editable right on the device pane (per metric, in bulk, and with wait periods), and every device class now reports uptime.
Editable alert thresholds New
Alert thresholds are now editable right from the device pane: adjust what counts as degraded per metric, edit several at once, and set wait periods so a brief blip doesn't page anyone at 3 a.m.
Uptime tracking everywhere New
Linux servers, MikroTik, generic SNMP, and Ubiquiti devices all report uptime as a monitored metric — reboots show up as issues instead of going unnoticed.