May 2014
Providing a consistent Internet Service is a complex challenge. A strong signal and an association between the AP and the client radio is no guarantee of quality service, nor an indicator of the client’s actual online experience.
Many factors can cause either intermittent connection drops or degraded service: multi-path, network congestion, bad equipment, ice build-up, overloaded back hauls and many other unpredictable factors.
As a WISP, if you have a way of knowing the true quality of every client’s connection at all times, you can have a significant impact on your ability to provide consistent service to everyone.
For example, using Swift Fox software you can plot the quality of every client on an access point and see trends and patterns. Is weather having an impact? Is the entire sector having issues at primetime or is it just two specific clients?
Are there patterns in power failures in the service area? Is noise at play? These are all questions that can be answered quickly and easily when there is a complete view of the true status of every single connection 24/7/365.
The traditional way to manage these challenges was to monitor the backhauls and access point for association, signal level and CCQ. Unfortunately this doesn’t provide a complete picture. If the client appears in the association list on the AP, that only indicates that a packet was seen from the device recently.
CCQ is a very unreliable statistic as lightly loaded connections lack the sample size needed to give accurate calculations. Some network monitoring suites send SNMP requests or basic pings to the device every 5 or 10 minutes. This can catch major issues with a client’s connection, but intermittent and slow connections will usually test as perfect using these methods.
At Swift Fox, we have found that by using a series of large pings, sent to every device, every minute of the day, tracking is possible of if a device is online and, how well the connection is performing minute by minute.
The connection can be tested not only for basic connection state, but round trip speed and packet loss can be directly measured. And by using pings, the impact on the network is negligible and all devices that support TCP/IP are supported! No need to rely on questionable SNMP data, CPE processors, out of date association lists, or poorly calculated CCQ information.
Having quality data is the first step and critical, but having a mountain of data, no matter how accurate it is, only has value if we can look at it in an easy to read format. This is where our Swift Fox “PingLog” feature is so valuable. It takes the result of all the tests to that client’s connection, (including the effect of all back hauls and intermediate routers) and displays it in a quick to read format.
Following is an example of a ping log for a user over the last 24 hours. The left side is 24 hours ago, the right hand side is now. Each coloured stripe is a single connection test and the quality is displayed from bright green, representing perfect, through yellow for marginal to red for poor to black for hard down.
![]() In this example, we can see that yesterday this particular subscriber was hard down for a number of hours, but they came back online. They had generally ok service with a few periods of poor service during the evening peak rush. If this subscriber called in, we could have them check the power to their CPE, and look at options for a less loaded access point for helping with peak congestion.
In this example, we can see that yesterday this particular subscriber was hard down for a number of hours, but they came back online. They had generally ok service with a few periods of poor service during the evening peak rush. If this subscriber called in, we could have them check the power to their CPE, and look at options for a less loaded access point for helping with peak congestion.
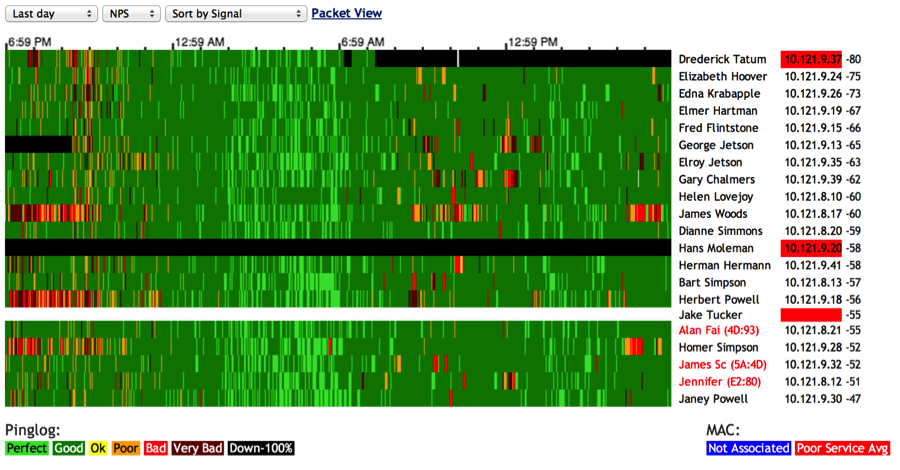
The PingLog gets even more powerful when we apply it across an entire Access Point, we can see trends and patterns.
In this case, we see a 900mhz access point that is not performing perfectly, but is not terrible either. It tells us a few things at a glance.
The sector is at it’s best between about 2AM and 7AM, when the load is lowest. Latency is generally higher than we would like most of the time and the map is largely dark green, not bright green, a sign of possible congestion or other issues.
As a WISP operator, you would know that this access point is starting to show signs of heavy load and it’s time to start contemplating upgrade options in this area. The clients are not really feeling it yet however, you would be ahead of their needs.
If you are proactive and add another AP or upgrade to a newer technology now, the users will not see any slowdowns in the coming months and there is a reduction in support calls, while customer satisfaction skyrockets. Once clients start complaining about slow speeds, catching it early makes you look like a real pro to your subscribers!
This is just one example of how having accurate and well-formatted data at a WISPs fingertips can save a lot of money and increase customer satisfaction.
Knowing at a glance, how your network is doing, now and in the past, is a hugely powerful tool that puts your business ahead of the competition.
Author: Scott Armstrong


